University of Minnesota
http://www.umn.edu/
612-625-5000
Echocardiographic Modes
There are three primary modes of producing the echo images used in clinical practice: M-mode, B-mode (2D imaging), and 3D imaging.
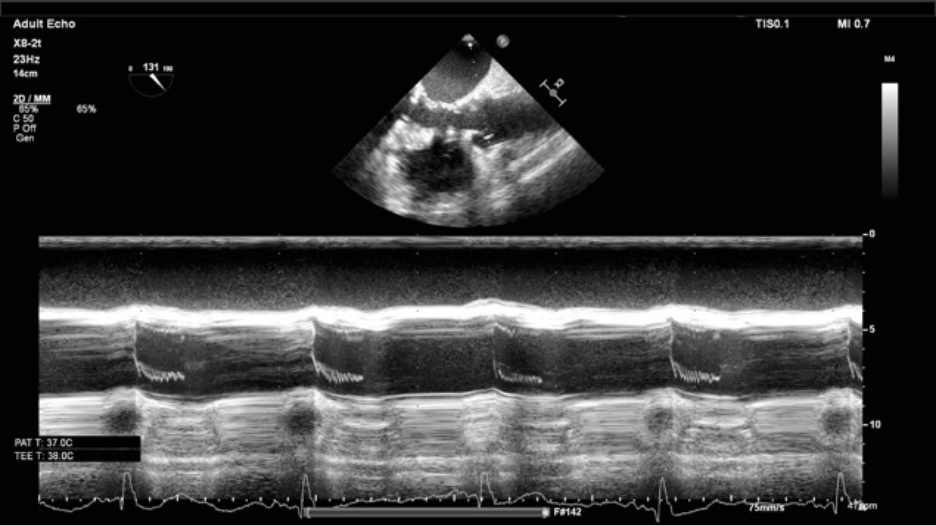
M-mode is an older form of ultrasound and will only give a single scan line of the picture being investigated.
The image formed has time on the x-axis and depth on the y-axis.
The density will appear by the shades of white and gray on the screen.
M-mode has a high frame rate and therefore is useful for fast moving objects.
Figure 3. M Mode through the aortic valve in a ME aortic valve long axis view TEE
In B-mode or 2D imaging the x-axis is depth, the z-axis is amplitude and there is no y-axis. A line of B-mode data is transmitted in an arc back and forth through the tissue. The images are generated very quickly to give the appearance of a continuous moving picture.
Figure 4. Four chamber view as seen in TEE.
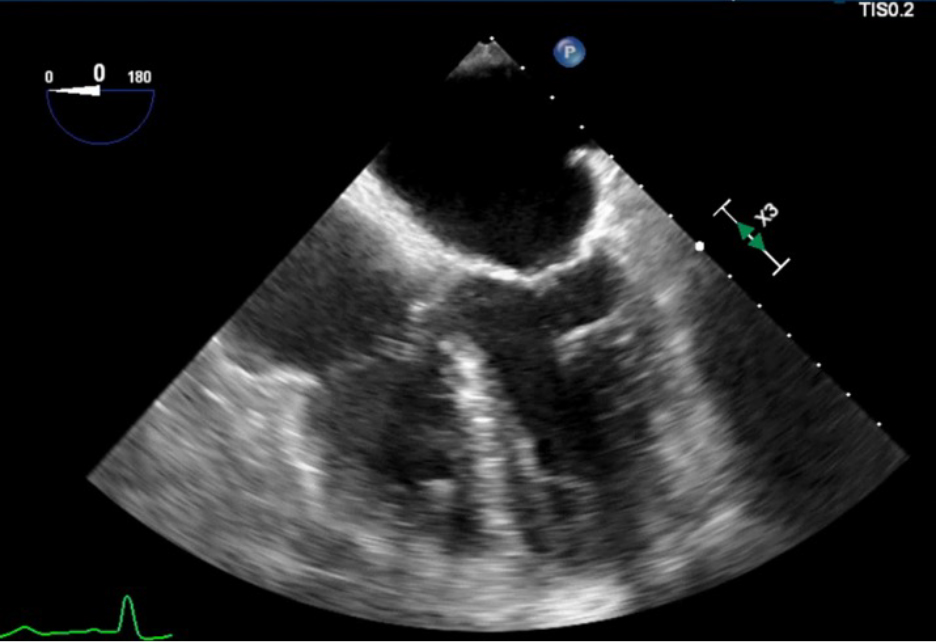
3D echo uses the same principles as 2D echo adding an extra plane. While a 2D echo probe crystal contains around 64 to 128 elements per row, a 3D probe has 3,000 elements per row. Instead of a triangular dataset that is then converted to a 2D image, a pyramidal dataset is created and converted to a 3D image. Shading is then used to convey depth on 3D echo.
Video 3. Mitral valve as seen in TEE using 3D. The anterior leaflet is located in the top and the posterior in the bottom of the image.
Doppler
The Doppler Shift is the amount of change in frequency that occurs when the sound wave bounces off the moving object. Calculating the Doppler Shift allows us to determine the speed and direction of a moving object, such as blood flow or valve leaflets.
There are two types of relevant Doppler: spectral Doppler and color flow Doppler (CFD).
Spectral doppler
There are 2 major forms of spectral Doppler: continuous wave Doppler (CWD) and pulse wave Doppler (PWD).
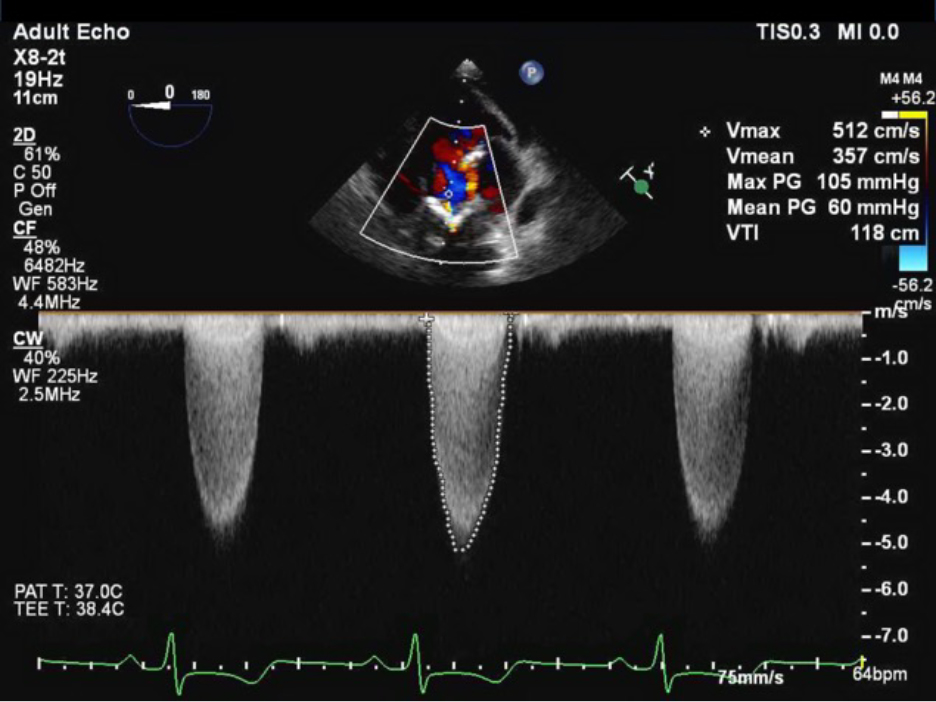
CWD: the echo probe uses two different crystals to continuously send and receive sound waves. By continuously sending and receiving sound waves, all velocities can be measured through the cursor line, but location of the highest velocity cannot be determined. This is known as range ambiguity. CWD is used for stenotic lesions because we assume that the highest velocity will be in the narrowest location in the line of the cursor.
Figure 5. CWD through the aortic valve TEE.
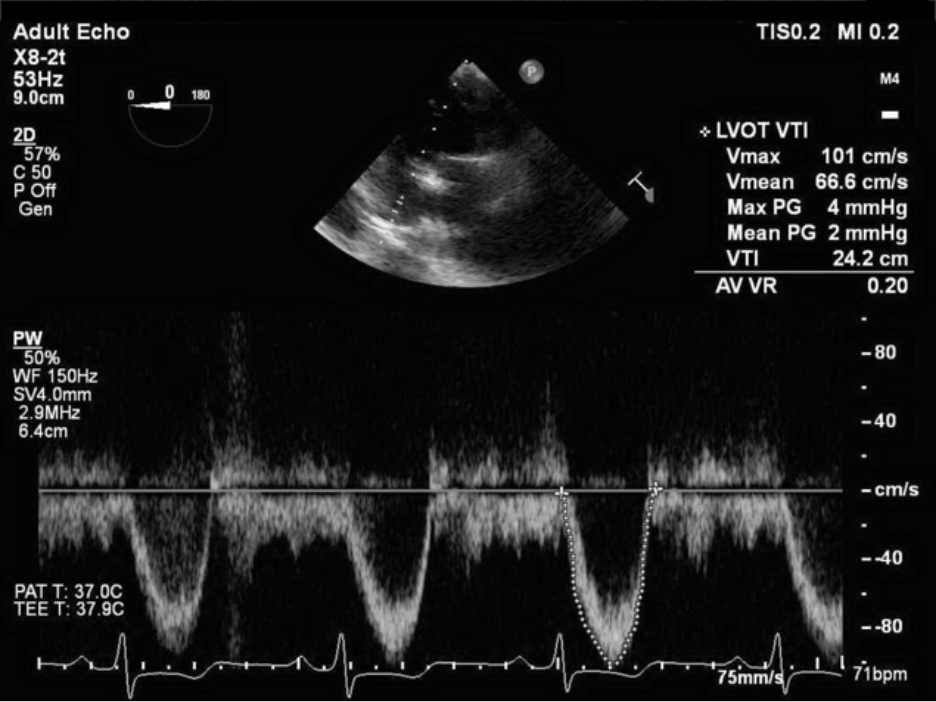
PWD uses only a single crystal which sends out a sound wave and waits for it to return before sending out the next pulse of sound. By placing the cursor at a known location, velocities can be determined at that one spot. This is known as range resolution. PWD is not ideal for measuring higher velocities and is subject to aliasing, a phenomenon whereby the velocity of an object is greater than the rate that the PWD can record, resulting in the tracing to appear on the opposite side of the baseline.
Figure 6. PWD through the LVOT TEE.
Color Flow Doppler (CFD)
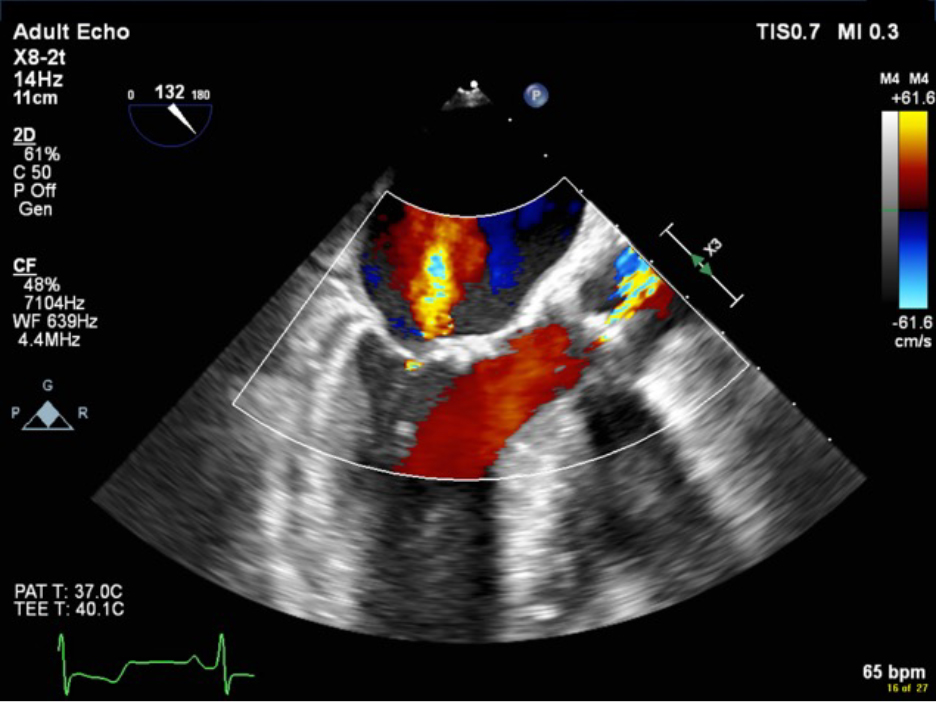
CFD is a type of PWD that works by assigning color to the direction of flow. The standard format is to assign blue color to blood flowing away from the probe and red to blood flowing towards the probe (BART = Blue Away, Red Towards).
Figure 7. Color flow doppler through the mitral valve, aortic valve and LVOT in the TEE ME LAX view.