|
The Cardiac Action Potentials
Although cardiac myocytes branch and interconnect with each other (mechanically via the intercalated
disc and electrically via the gap junctions; see below), under normal conditions the heart should be
considered to form two separate functional networks of myocytes: the atria and the ventricles. This
is due to the separation of atrial and ventricular tissues by the fibrous skeleton of the heart (the
central fibrous body). This skeleton is comprised of dense connective tissue rings that surround the
valves of the heart, fuse with one another, and also merge with the interventricular septum. More
specifically, this fibrous structure can be thought to: 1) form the foundation to which valves
attach; 2) prevent overstretching of the valves; 3) serve as a point of insertion for cardiac muscle
bundles; and 4) act as an electrical insulator that prevents the direct spread of action potential
from the atria to the ventricles (normal spread is through the bundle of His).
A healthy myocardial cell has a resting membrane potential of approximately ~90 mV (Figure 3). This
resting potential can be described by the Goldman-Hodgkin-Katz equation, which takes into account the
permeability (P) as well as the intracellular and extracellular concentration of ions [X], where X is
the ion.
| Vm = |
(2.3 R*T/F)*log10
|
PK[K]o + PNa[Na]o + PCl[Cl]i + PCa[Ca]o + ...
PK[K]i + PNa[Na]i + PCl[Cl]o + PCa[Ca]i + ... |
In the cardiac myocyte, the membrane potential is dominated by the K+ equilibrium potential. An
action potential is initiated when this resting potential becomes shifted towards a more positive
value of approximately ~60 to ~70 mV (Figure 3). At this threshold potential, the cell&aposs
voltage-gated Na+ channels open and begin a cascade of events involving other ion channels. In
artificial electrical stimulation, this shift of the resting potential and subsequent depolarization
is produced by the excitation delivered through the pacing system. The typical ion concentrations for
a mammalian cardiac myocyte are summarized in Table 1 and graphically depicted in Figure 3.
Table 1
Ion |
Intracellular conc. (mM) |
Extracellular con. (mM) |
Sodium (Na+) |
5-34 |
140 |
Potassium (K+) |
104-180 |
5.4 |
Chloride (Cl-) |
4.2 |
117 |
Calcium (2+) |
10-7 |
3 |
When a potential of the myocyte is brought to the threshold, normally via transmitted activation from
a neighboring cell, voltage-gated fast Na+ channels actively open (activation gates); the
permeability of the sarcolemma (plasma membrane) to sodium ions (PNa+) dramatically increases.
Because the cytosol is electrically more negative than extracellular fluid and the Na+ concentration
is higher in the extracellular fluid, Na+ rapidly crosses the cell membrane. Importantly, within a
few milliseconds, these fast Na+ channels automatically inactivate (via inactivation gates) and PNa+
decreases.
|
The membrane depolarization due to the activation of Na+ induces the opening of the voltage-gated
slow Ca2+ channels located within both the sarcolemma and sarcoplasmic reticulum (internal storage
site for Ca2+). Thus, there is an increase in the permeability of Ca2+ (Pca2+), which allows the
concentration to dramatically increase intracellularly (Figure 3). At the same time, the membrane
permeability to K+ ions decreases due to closing of K+ channels. For approximately 200 to 250 msec,
the membrane potential stays close to 0 mV (i.e., depolarized relative to at rest), as a small
outflow of K+ just balances the inflow of Ca2+. After this fairly long delay, voltage-gated K+
channels open and active repolarization is initiated. The opening of these K+ channels (increased
membrane permeability) allows for K+ to diffuse out of the cell due to its concentration gradient. At
this same time, Ca2+ channels begin to close, and net charge movement is dominated by the outward
flux of the positively charged K+, restoring the negative resting membrane potential to approximately
~90 mV (Figure 3).
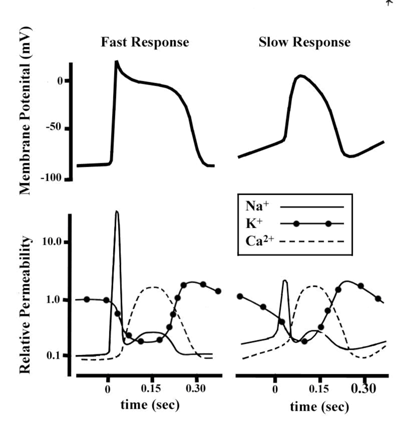
As mentioned above, not all action potentials that are elicited in the cardiac myocardium have the
same time courses. More specifically, slow and fast response cells have different shaped action
potentials with different electrical properties in each phase. Recall that the pacemaker cells (slow
response type) have the ability to spontaneously depolarize (unstable resting potential) until they
reach threshold and then elicit action potentials. Action potentials from such cells are also
characterized by a slower initial depolarization phase, a lower amplitude overshoot, a shorter and
less stable plateau phase, and repolarization to an unstable, slowly depolarizing resting potential
(Figure 4). In the pacemaker cells, at least three mechanisms are thought to underlie the slow
depolarization that occurs during phase 4 (diastolic interval): 1) a progressive decrease in PK+; 2)
a slight increase in PNa+; and 3) an increase in PCa2+.
|
|
|

Figure 4. The comparative time courses of membrane potentials and ion permeabilities that would typically occur
in a fast response (left, e.g., ventricular myocytes) and a slow response cell (right, e.g., nodal myocytes). From Sigg et al., 2009
|
|
|


